Testing a new STARprobeTM Measurement Based Ratio Control Algorithm Using a Dynamic
Cell Simulator
M. Dupuis, Jonquière, Jean-Pierre Gagné, Chicoutimi, Pascal Côté, Chicoutimi
In addition to the two main tasks an aluminium reduction cell controller has to perform, namely to
keep both the dissolved alumina concentration in the bath and the anode cathode distance (ACD)
under tight control [1], modern cell controllers are also in charge of keeping the bath ratio (or
excess AlF3) concentration under control.
This task has proven to be quite challenging despite the fact that, at first glance at least, it looks
quite straightforward. Fluoride evolves out of the cell; a big fraction of that fluoride is captured by
the fresh alumina in the scrubber and returns to the cell as part of the secondary alumina feed to it.
The part that is not returning to the cell must be compensated by direct AlF3 feeding in order to keep
constant the bath ratio in the cell. The cell controller performs that task using feedback control
algorithms based on regular measurements performed by cell operators.
Recently Alcoa has develop a revolutionary new technology to measured bath ratio in potroom
almost as quickly as you can measure bath temperature [2,3]. Furthermore, in addition of the excess
AlF3 concentration, the new STARprobeTM can also measures the bath temperature, the dissolved
alumina concentration and the cell superheat. That last information can be use as part of the cell
control logic as previously presented in [4] per example.
GeniSim’s Dyna/Marc dynamic aluminium reduction cell simulator cell simulator has been used to
compare the efficiency of the traditional combined bath sample/XRD analysis and bath temperature
measurement bath ratio control logic and a new control algorithm based on STARprobesTM excess
AlF3 concentration and superheat measurements.
Performing the AlF3 mass balance
Using a 300 kA cell as example, the fluoride mass balance can be performed as follows. Fluoride
evolved out of the cell at a rate dictated by many factors like the bath ratio and temperature and the
state of the anode cover [5]. In the current example, the fluoride evolution rate is calculated to be
33.6 kg F / T Al with the cell conditions selected, namely 10% excess AlF3, 970 °C and a good
anode cover. For a 300 kA cell producing 94.7 kg Al / hr, this represents the equivalent of 4.7 kg of
AlF3 that evolves out of the cell and hence must be replaced each hour.
Assuming that after taking into consideration the neutralization of some of the fluoride absorbed by
the fresh alumina in the scrubber by the sodium already present into it, the equivalent of 3.6 kg /hr
of AlF3 is fed back to the cell by the secondary alumina (on average or at the nominal 100% alumina
feeding rate). This leaves 1.1 kg /hr of AlF3 that must be directly fed using a point breaker feeder
(PBF) under the supervision of the cell controller.
Considering that the cell contains close to 8 tons of bath and hence about 800 kg of excess AlF3,
this means that if the direct AlF3 is completely stopped for some reason, it would take about 72
hours for the mass of excess AlF3 to be reduced by 80 kg and hence the bath excess AlF3
concentration to drop by 1% to 9%. Considering that relatively slow response time of the cell, it
should be rather easy to keep the excess AlF3 concentration under tight control, but since it is clearly
not the case in the great majority of smelters, some other factors must be complicating things.
Daily operations influence on bath ratio: In the above mass balance calculation, about 75% of the
AlF3 is fed back to the cell as part of the alumina feeding, but in modern continuous tracking control
logic, the alumina is never fed at the nominal 100% rate to the cell. As a result, the excess AlF3
concentration is evolving up and down according to the feeding cycle. The direct additions are also
performed in discrete events, per example 2 kg every 110 minutes, in order to average 1.1 kg / hr
per example. Those discrete additions also influence the short term variation of the excess AlF3
concentration.
In addition of the irregular AlF3 addition, the excess AlF3 concentration variation is influenced by
thermal events affecting the AlF3 evolution like the bath temperature but more importantly by the
ledge thickness variation: as ledge is mostly pure cryolite, ledge formation increases the
concentration of the excess AlF3. Ledge formation occurs after anode change events per example.
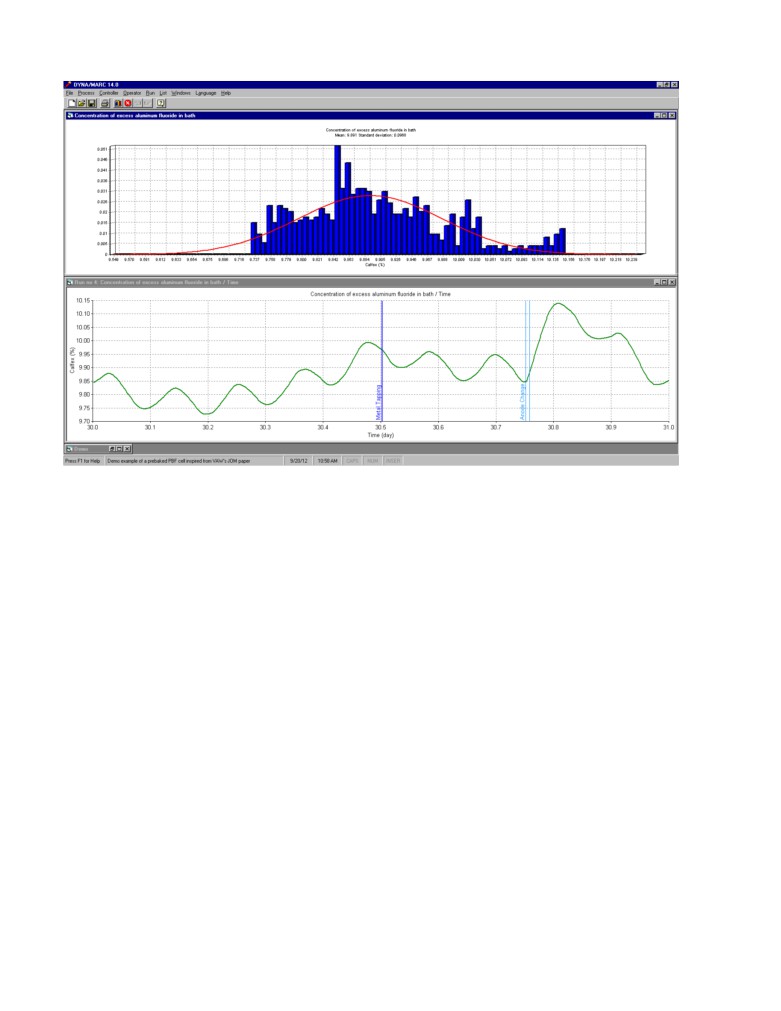
Figure 1 shows the daily variation of the concentration of AlF3 in the bath in absence of control and
any AlF3 mass imbalance. The standard deviation on the average value is about 0.1%.
Sampling frequency and delayed XRD results: The next factor complicating things is the fact
that assessing the bath chemistry required manual interventions. The traditional way of proceeding
requires manual bath sampling, manual processing of the bath samples, at best semi-automatic
analysis of the bath samples by a XRD instrument and manual input of the results in a database
accessible to cell controllers. Considering the cost of a XRD analysis, it is typical to take bath
sample every second day and to get results at 8 to 24 hours after the actual bath sampling.
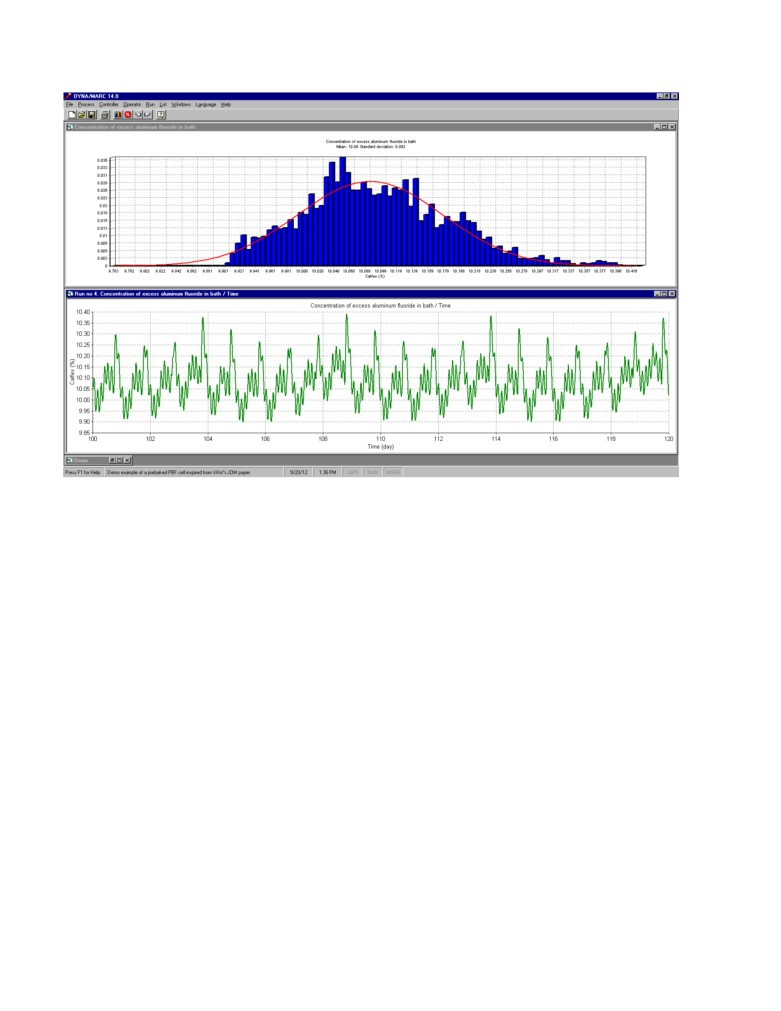
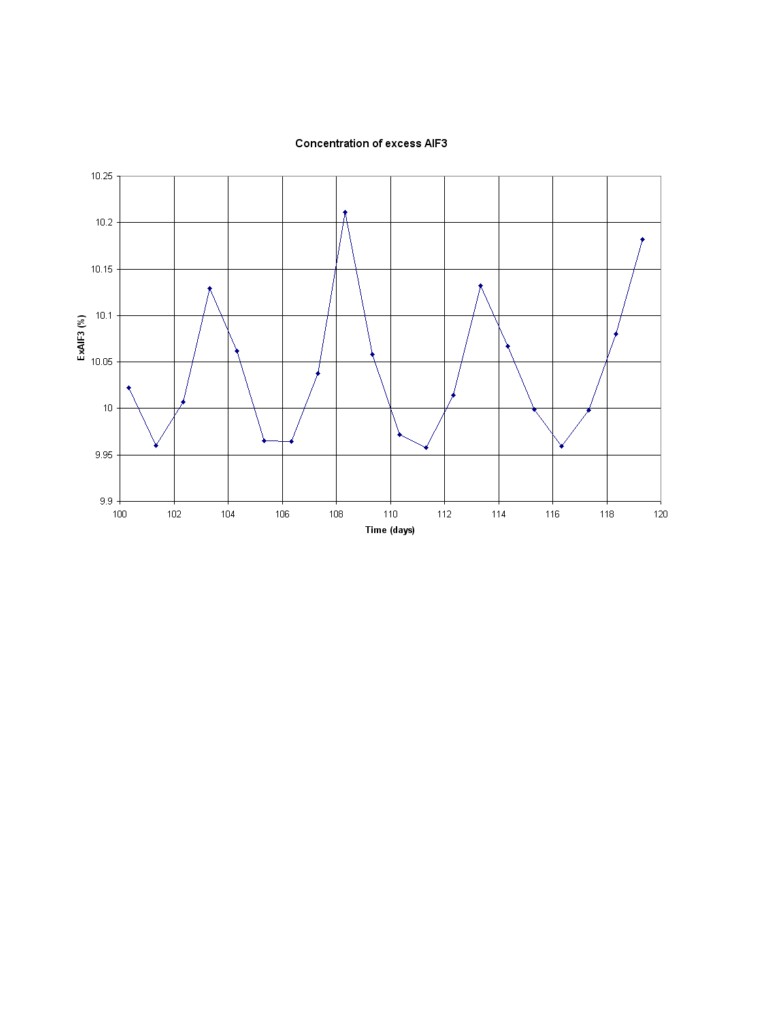
Figure 2 shows the variation of the AlF3 for a period of 20 days again without control and any mass
imbalance. Figure 3 shows the results of the bath sampling performed once a day always at the same
time. The delay between the actual sampling and the time the results of the analysis becomes
available is clearly not an issue when the concentration is drifting very slowly. Yet any delay in the
feedback response can cause instability depending on the controller setup.
So far, despite the daily events “process noise”, the sparse sampling frequency and the delay in
getting the sampling analysis results, considering the very slow cell response time, there is no
serious problem that would explain why it is so difficult to control the bath ratio.
Bath sampling noise problem: But, a new problem affecting bath ratio control has recently been
identified: it is the bath sampling noise due to the fact that the bath is far from being homogeneous
[6]. The standard deviation of that bath sampling noise has been evaluated to be around 0.5 %
which is 5 times greater than the process noise generated by daily events. That bath sampling noise,
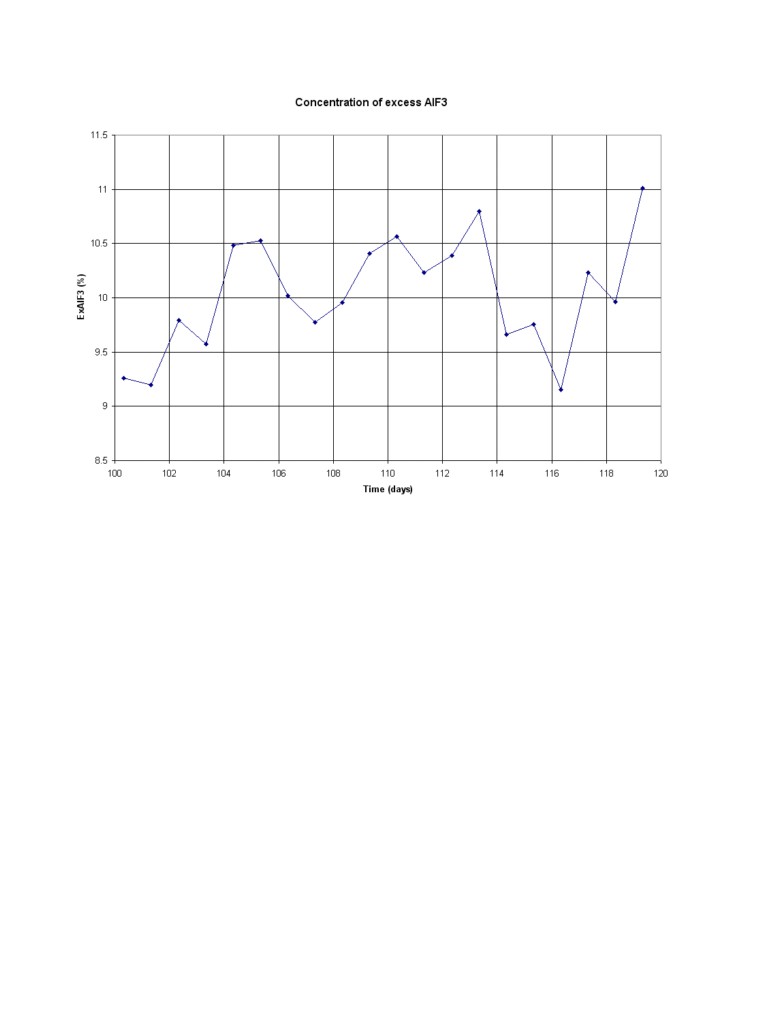
contrary to the daily events noise is completely unpredictable. Figure 4 shows the results of bath
sampling performed on the 20 days period presented in Figure 2 when a 0.5% white noise is added
to the noise free results presented in Figure 3.
Simulated process response using standard control without any process perturbation:
Now, we want to test a typical control logic where both the delayed XRD analysis from bath
samples and measured bath temperature are used to correct the direct AlF3 feeding rate as it is
commonly done in the industry these days. The proportional band was set to 0.5 kg/hr% for the 24
hours delayed bath XRD analysis results and -0.1 kg/hr°C for the bath temperature measurement.
The bath sampling and the temperature measurement are done simultaneously every 24 hours.
A bath sampling noise having a standard deviation of 0.5% have been added to the XRD analysis
results following observation recently reported [6]. For the temperature measurement, a bath
sampling noise having a standard deviation of 2.5 °C have been added as reported in [6].
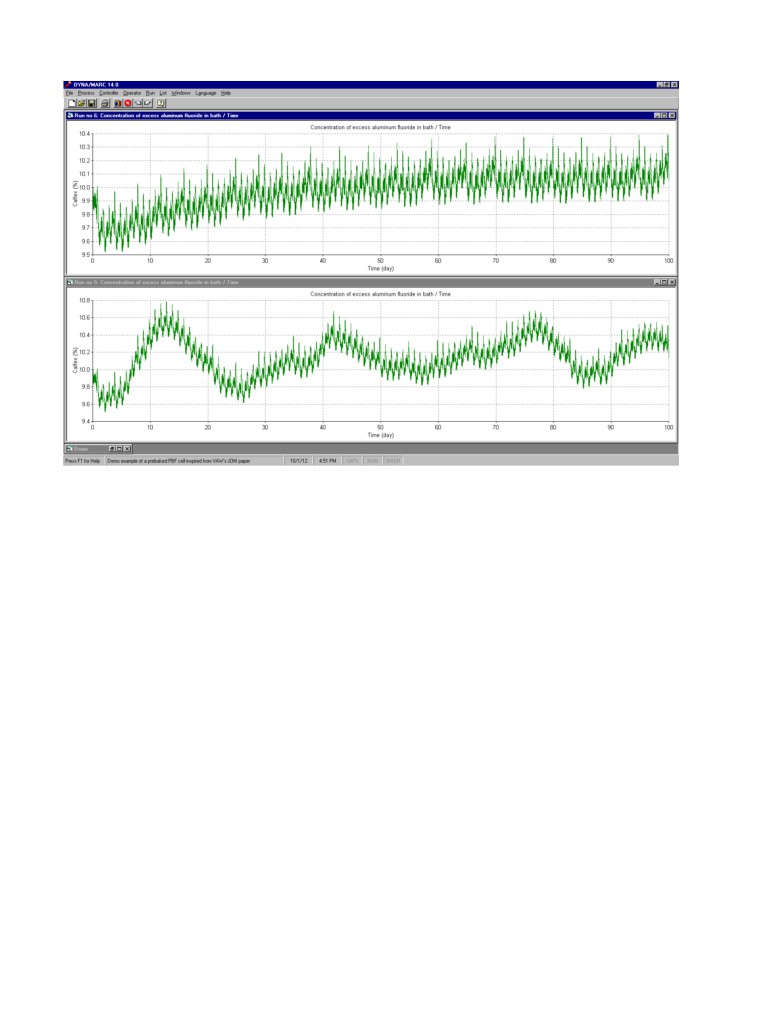
Figure 5 present the obtained results in the dynamic cell simulator for a period of 100 days. The top
graph presents the results obtained without any control in the absence of process perturbation. The
initial bump is an indication that the steady state conditions used as initial transient conditions are
not 100% representative of the long term pseudo steady state conditions.
The bottom graph presents the results obtained with feedback control active. Unfortunately, it is not
as good as the results without control indicating that the bath sampling noise combined with the 24
delay in the bath sampling analysis result is affecting the stability of this feedback control loop.
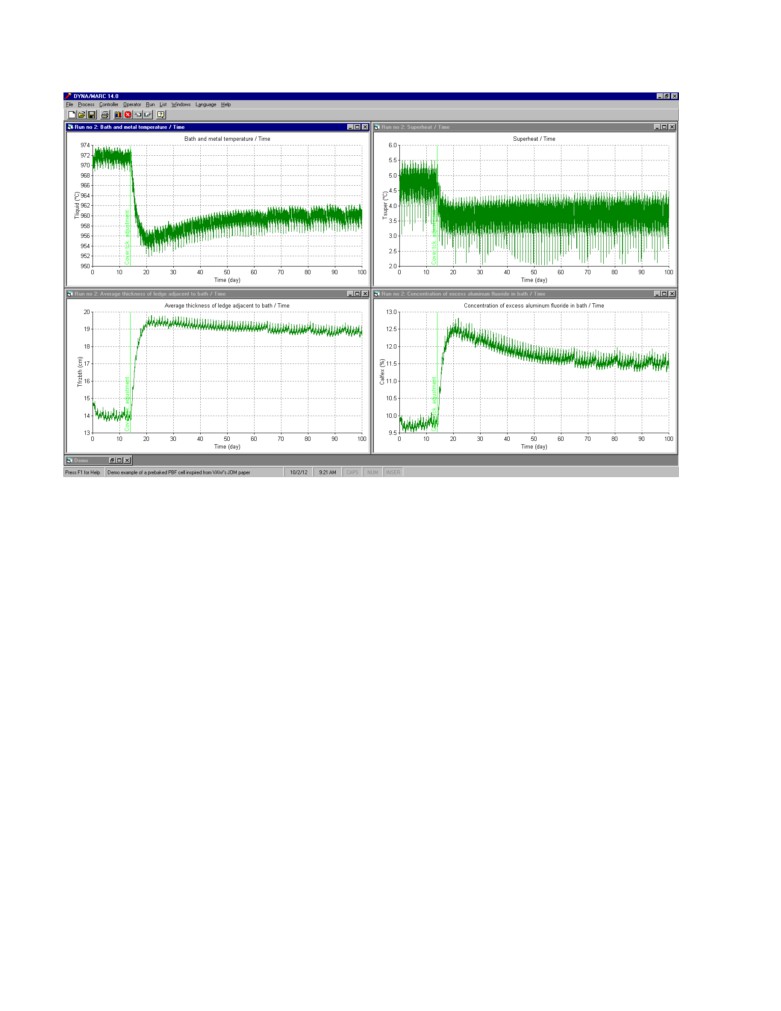
Simulated process response using standard control with a significant process perturbation:
In order to more seriously test the stability of the feedback control loop, a major perturbation is
added to the simulation. On day 14, about half of the anodes cover material is removed in doing so
increasing the anode panel heat loss by about 30 kW from 230 kW to 260 kW. As we can see in
figure 6, as a natural response, the cell must reduce its cathode heat loss of the same amount by
reducing its superheat by about 1 °C and increasing its ledge thickness by about 5 cm. As a result, of
this extra ledge formation, the excess AlF3 increase by about 2% and remains close to 12% if the
direct AlF3 additions remain unchanged.
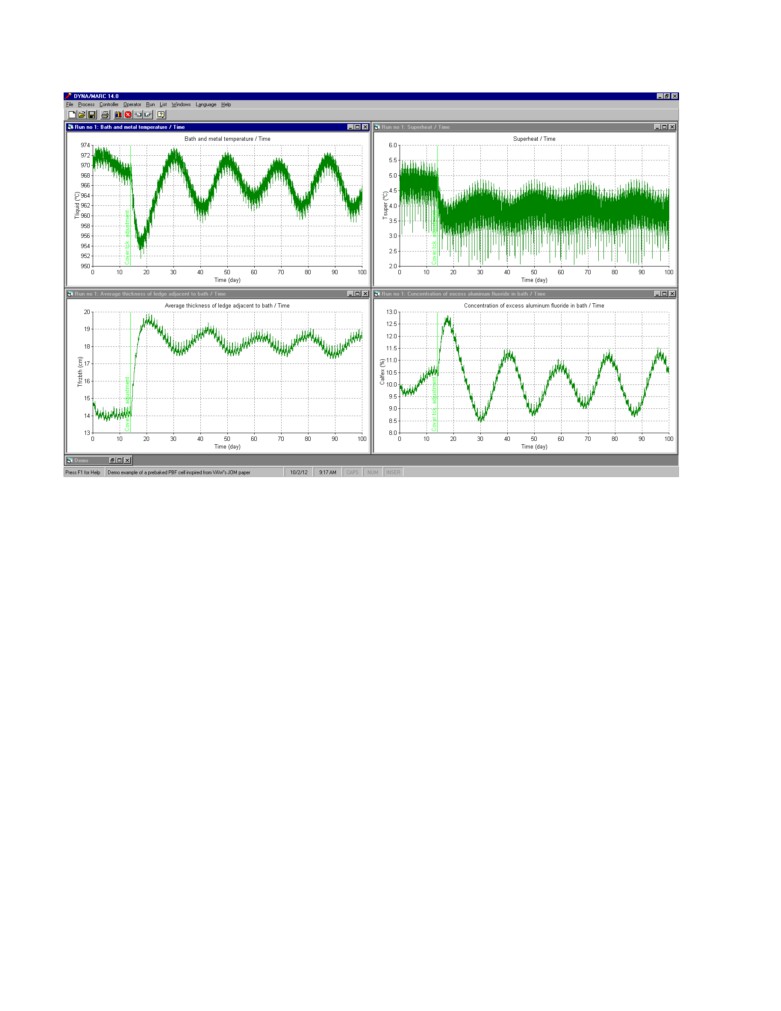
This is clearly a case where some feedback control is required. Figure 7 presents the results obtained
using the standard control described above. After the change of superheat, the 970 °C temperature
target is no longer compatible with the 10% excess AlF3 target, this combined with the 1 day offset
between the AlF3 feedback and the temperature feedback generates a cyclic response characteristic
of somewhat unstable feedback control. That type of oscillations with a wave length of about 20
days and an amplitude of about 2.5% are very common place in smelters. Those undesired
oscillations occur despite the fact that the values of the proportional constants were careful selected
in order to avoid feedback loop instabilities.
The new STARprobeTM
The STARprobeTM is a portable device that takes real-time measurements of bath properties, such
as Superheat, Temperature, Alumina concentration and bath Ratio or acidity (STAR), in electrolysis
cells. This synchronicity of measurements is a most important step forward in improving the control
and efficiency of electrolysis cells. It unites the conventional processes of temperature measurement
and bath sampling-analysis into one online measurement, simplifies and greatly shortens the process
and time space from measurement/sampling to pot control decision. The pot control decision can
therefore be based on the real time cell conditions rather than those from few hours ago or from as
long as 24 hours ago.
This integrated real-time measurement system consists of four major components:
•
Reusable probe tip
•
Portable stand to fit various pot configurations
•
Electronics for data acquisition and analysis, and wireless communications for data transfer
•
Tablet PC with programs to perform all necessary tasks during measurements.
Considering the great advantages of the STARprobeTM, Alcoa has decided to share the technology
with the rest of the aluminium industry starting from 2012. In this regard, Alcoa has just appointed
STAS, a well recognized leader in the aluminium industry (www.stas.com ), to commercialize the
new STARprobeTM analyzing system.
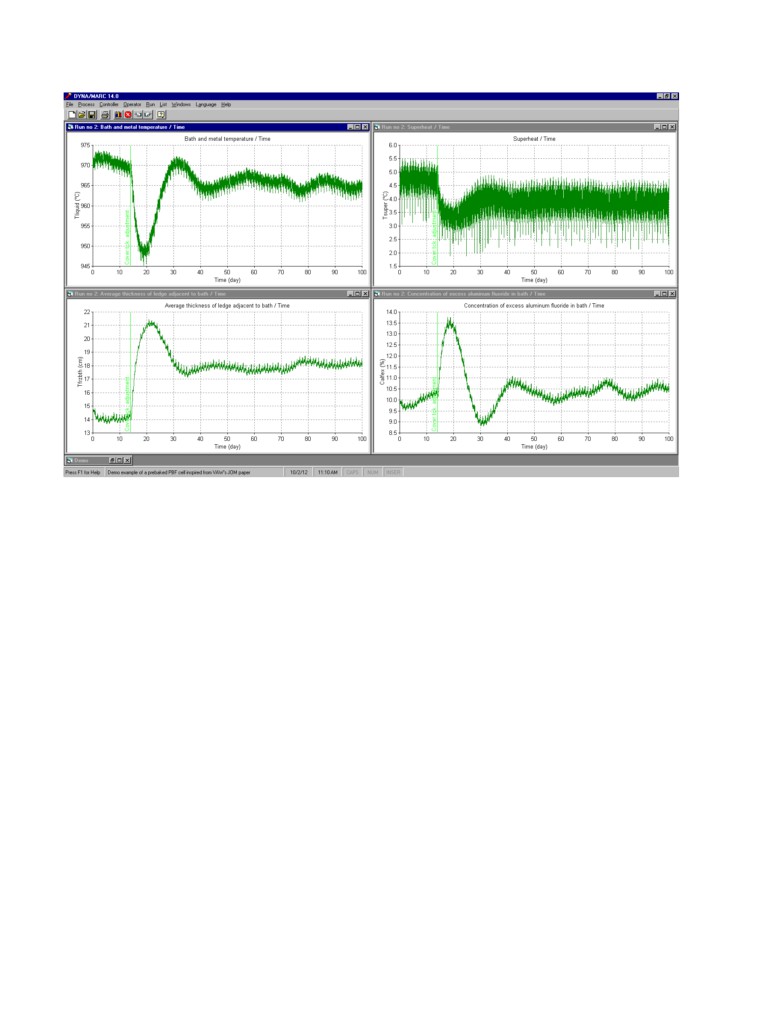
Simulated process response using STARprobeTM measurements based control with a
significant process perturbation: The exact same major perturbation is use to test the efficiency of
a STARprobeTM measurements based feedback control loop. The same 1 day measurement
frequency is used and the same 0.5 kg/hr% proportional constant for the AlF3 feedback loop.
Obviously in this case however, the measurement results are available without delay. In addition,
the measured superheat is also used in a separate feedback loop where the target cell resistance is
adjusted based on the offset between the target superheat and the measured superheat.
The measured superheat is also affected by a very significant bath sampling noise. That bath
sampling noise was estimated to have a standard deviation of about 2°C in [6] so a 2°C standard
deviation white sampling noise was added to the simulation.
The obtained results are presented in the figure 8. We can see that the response to the perturbation is
slower than in the previous case because there is no longer a correction based on the temperature
offset and a ±1 °C deadband on the superheat target was used in order not to wrongly respond to
the noise in the superheat measurements. Yet after a 25 days transient response to the perturbation,
the excess AlF3 concentration goes back to its target value and remains on target without
oscillations after that.
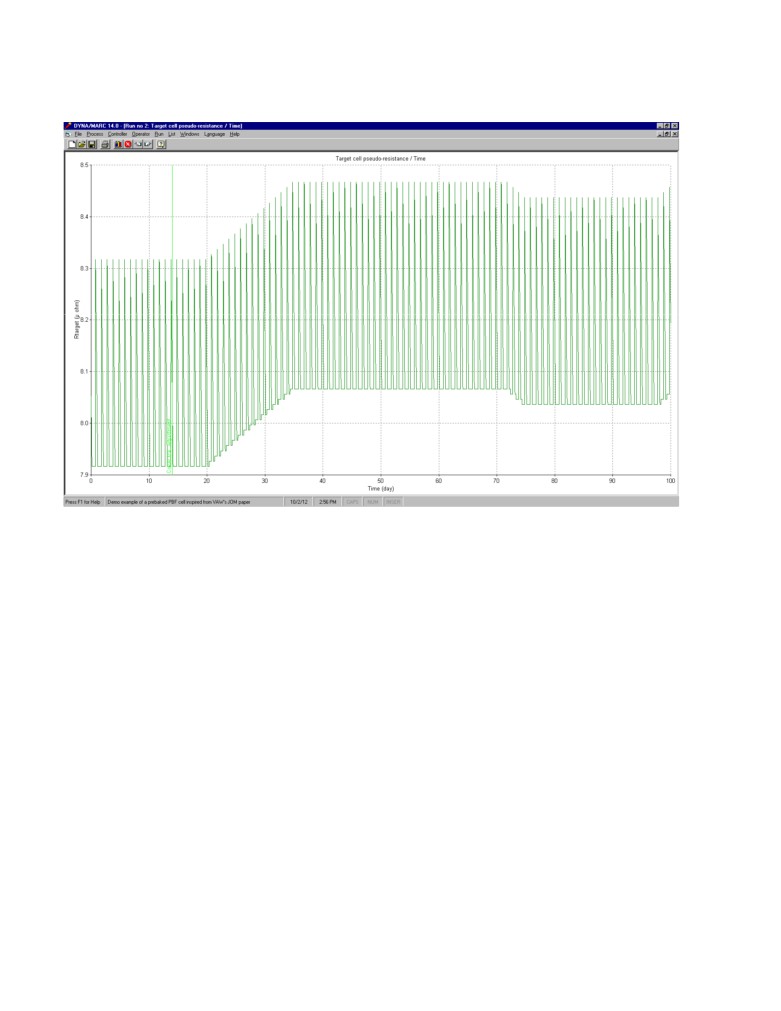
Figure 9 shows the evolution of the target cell resistance, a result, a 0.01 micro-ohm correction on
the target cell resistance was apply each for 15 days for a total 0.15 micro-ohm correction after a
delay of 6 days. This 0.15 micro-ohm “permanent” correction ensure that the superheat remains
within the 3.5 °C to 5.5 °C range despite the fact that the anode panel now dissipates an extra 30
kW of heat loss.
Conclusions
This study demonstrates study the value of using a dynamic cell simulator to optimize existing cell
controller algorithms or to test new ones without putting real cells at risk. The Dyna/Marc cell
simulator used in this study is available to the whole aluminium industry through GeniSim Inc.
Version 14 supports adding the observed bath sampling noise to the AlF3 measurements and using
STARprobeTM measurements instead of bath samples/XRD analysis to perform bath ratio control.
A new control logic scheme based on independent control of the excess AlF3 and the cell superheat
made possible with the revolutionary new STARprobeTM measurement tool was demonstrated to be
superior to the standard single feedback control loop using two target variables namely the excess
AlF3 and the operating temperature to control a single control action namely the direct AlF3
additions.
The STARprobeTM developed by Alcoa [2,3] is now available to the hole aluminium industry
References
[1] M. Dupuis, Testing cell controller algorithms using a dynamic cell simulator, ALUMINIUM • 1-
2/2012, (2012), 50-55.
[2] Wang, X., Hosler, B. and Tarcy, G. Alcoa STARprobeTM, Light Metals, (2011), pp 483-489
[3] Wang, X., Tarcy, G., Batista, E. and Wood, G. Active pot control using Alcoa STARprobeTM,
Light Metals, (2011), pp 491-496
[4] T. Rieck, M. Iffert, P.White, R. Rodrigo and R. Kelchtermans, Increased Current Efficiency and
Reduced Energy Consumption at the TRIMET Smelter Essen using 9 Box Matrix Control, Light
Metals, (2003), pp 449-456.
[5] W. Haupin, H. Kvande, Mathematical Model of Fluoride Evolution from Hall-Héroult Cells,
Proceedings from the International Jomar Thonstad Symposium, ed. by A. Solheim and G. M.
Haarberg, Trondheim, Norway, October 16 - 18, (2002), 53 - 65.
[6] M. Dupuis, P. Bouchard and J. P. Gagné, Measuring bath properties using the STARprobeTM ,
19th International ICSOBA Symposium (2012), to be published.
Author
Dr. Marc Dupuis is a consultant specialized in the applications of mathematical modeling for the
aluminium industry since 1994, the year when he founded his own consulting company GeniSim Inc
(www.genisim.com). Before that, he graduated with a Ph.D. in chemical engineering from Laval
University in Quebec City in 1984, and then worked ten years as a research engineer for Alcan
International. His main research interests are the development of mathematical models of the Hall-
Héroult cell dealing with the thermo-electric, thermo-mechanic, electro-magnetic and hydrodynamic
aspects of the problem. He was also involved in the design of experimental high amperage cells and
the retrofit of many existing cell technologies.
Jean-Pierre Gagné is the Director of the ALCOA - STAS R&D Team. Master degree in Active
Control of Vibrations, I obtained in 1993. Since 1997, I am working for STAS mainly in R&D
projects. STAS is a company specialised in the design, fabrication and manufacturing of equipment
for the aluminum industry as well as in commercialisation of new technologically advanced
equipment. STAS is located in the heart of Quebec, Canada, where more than 10% of the world's
primary aluminum is produced in the most technologically advanced plants.
Pascal Côté is the Director of the Development & Innovation group for STAS. Professional
engineer specialized in the development of new technologies for the aluminium industry. Member
of the International scientific committee on processing of semi-solid alloys and composites.
Figure 1: Daily excess AlF3 concentration variation without control and any mass imbalance as
generated by Dyna/Marc cell simulator
Figure 2: 20 days excess AlF3 concentration variation without control and any mass imbalance
Figure 3: Corresponding 20 days of excess AlF3 concentration sampling results assuming no bath
sampling noise
Figure 4: Corresponding 20 days of excess AlF3 concentration sampling results assuming 0.5 %
standard deviation white sampling noise
Figure 5: Simulation of the process without perturbation; top without control, bottom with feedback
control, 10% target concentration (XRD results, once per day, 1 day delay, 0.5 kg/hr% proportional
band and -0.1 kg/hr°C proportional band)
Figure 6: 100 days natural response (no control) to a significant reduction of the anode cover
material thickness resulting in an increase the anode panel heat loss by 30 kW
Figure 7: Simulation of the process with a significant perturbation; feedback control, 10% target
concentration (XRD results, once per day, 1 day delay, 0.5 kg/hr% proportional band and -0.1
kg/hr°C proportional band)
Figure 8: Simulation of the process with a significant perturbation; feedback control, 10% target
concentration (STARprobeTM measurements once per day, 0.5 kg/hr% proportional band and daily
0.1 micro-ohm target resistance correction due to superheat offset from target)
Figure 9: Evolution of the cell target resistance (there is a 0.4 micro-ohm change of target resistance
each day during the anode change event)